Audience: Organization employees, stakeholders, and their audience (general public)
Tools used: Google Sheets, Tableau, Adobe Illustrator, pencil and paper
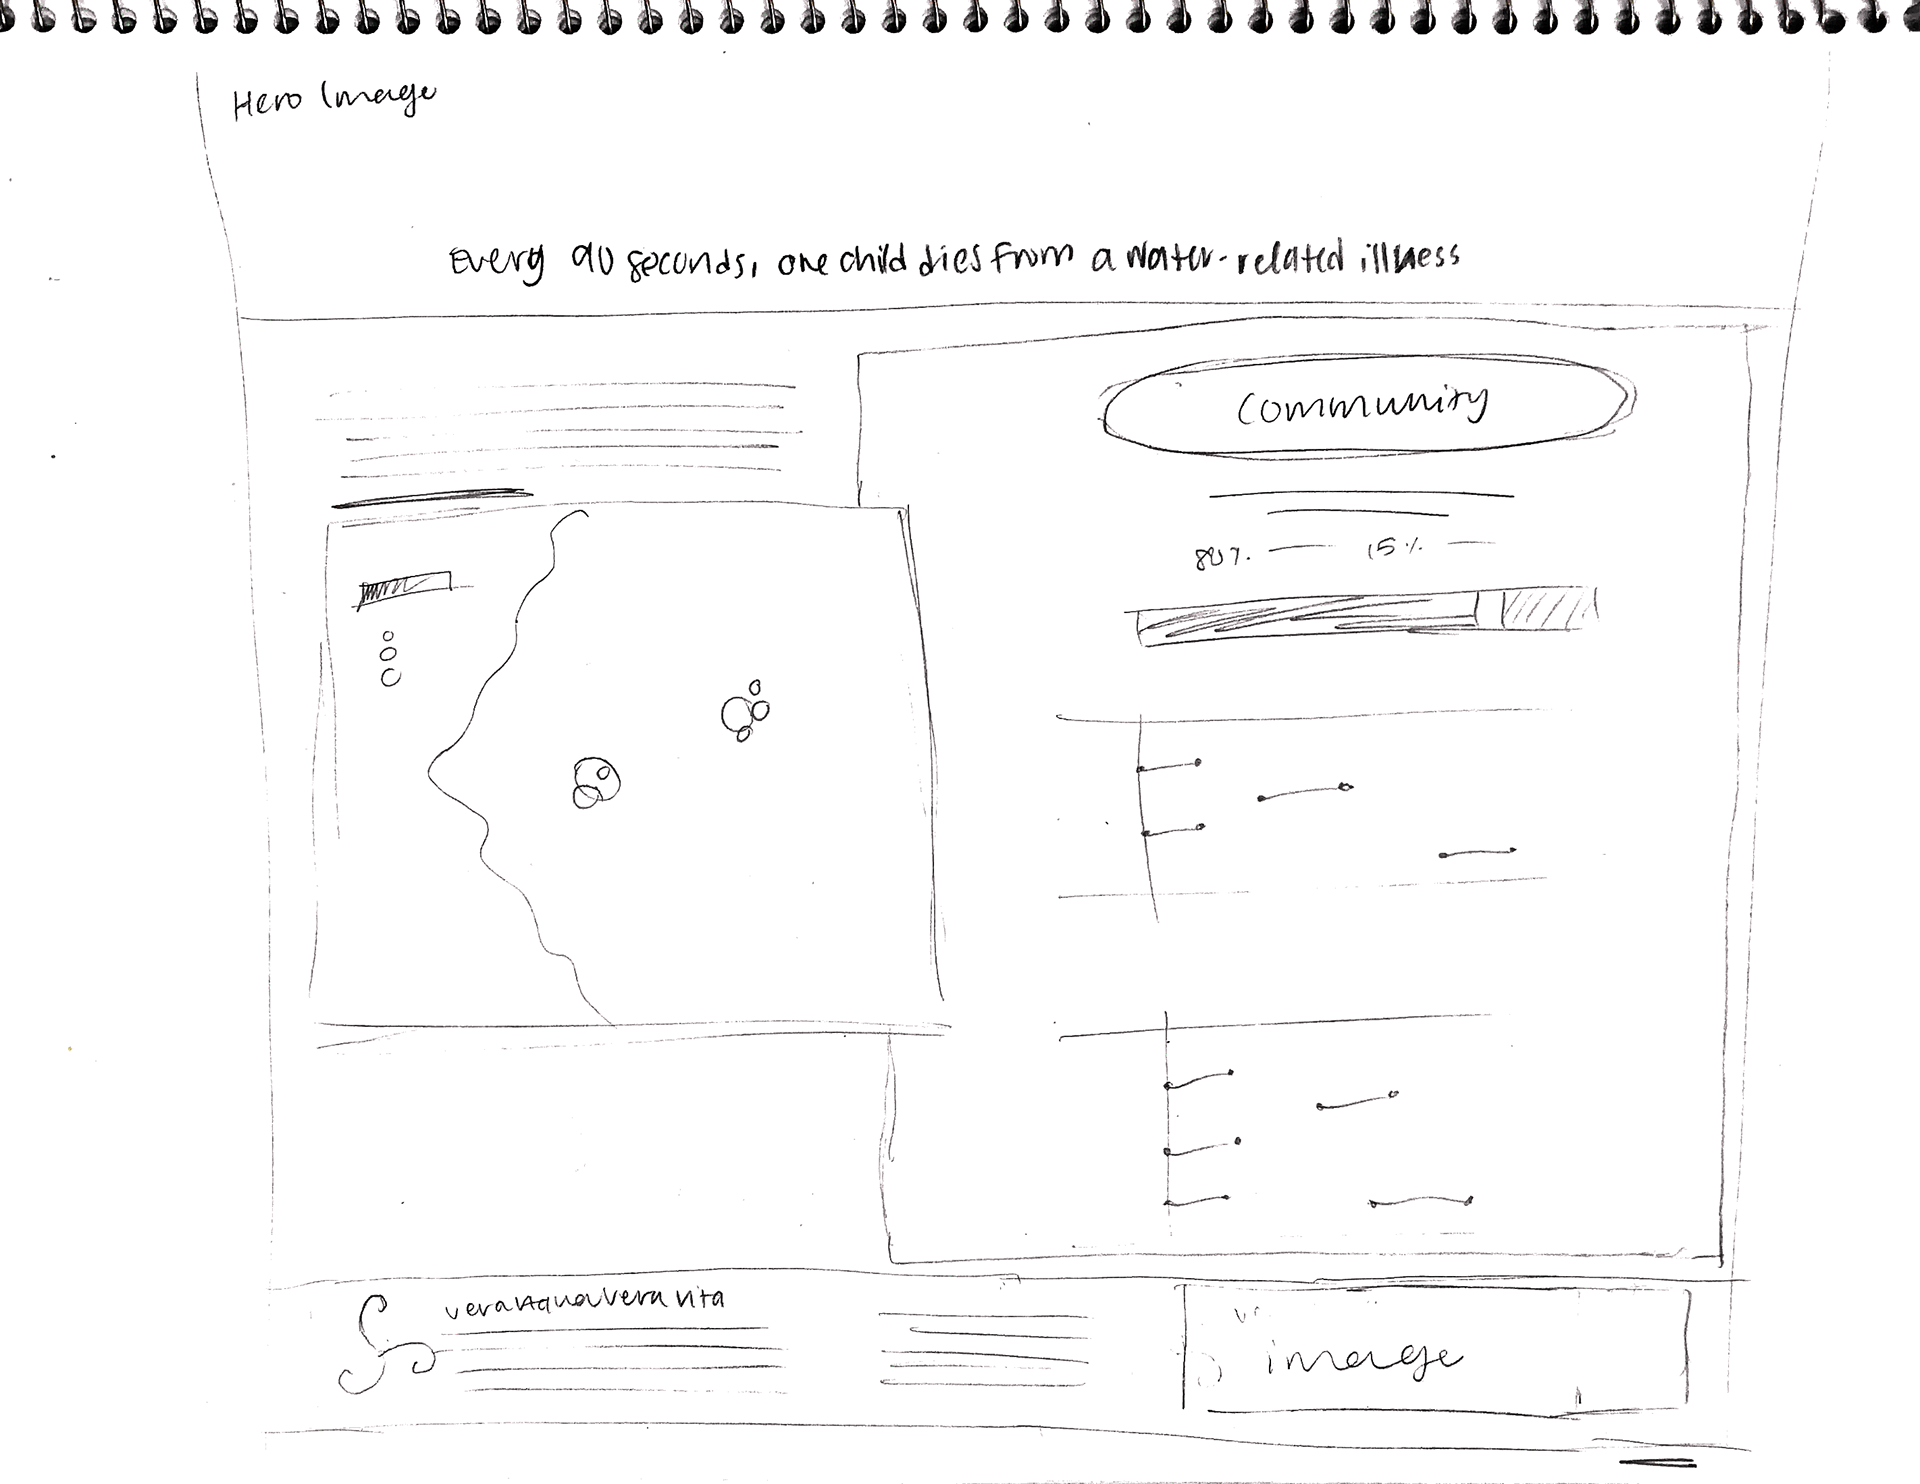
As a volunteer for a Viz for Social Good project involving the organization Vera Aqua Vera Vita, I created a visualization detailing the water crisis in seven Peruvian communities. After I pitched the visualization to founders, it was selected as one of three winners by Vera Aqua Vera Vita's CEO and team.
View the interactive Tableau dashboard to explore tooltips and filters.

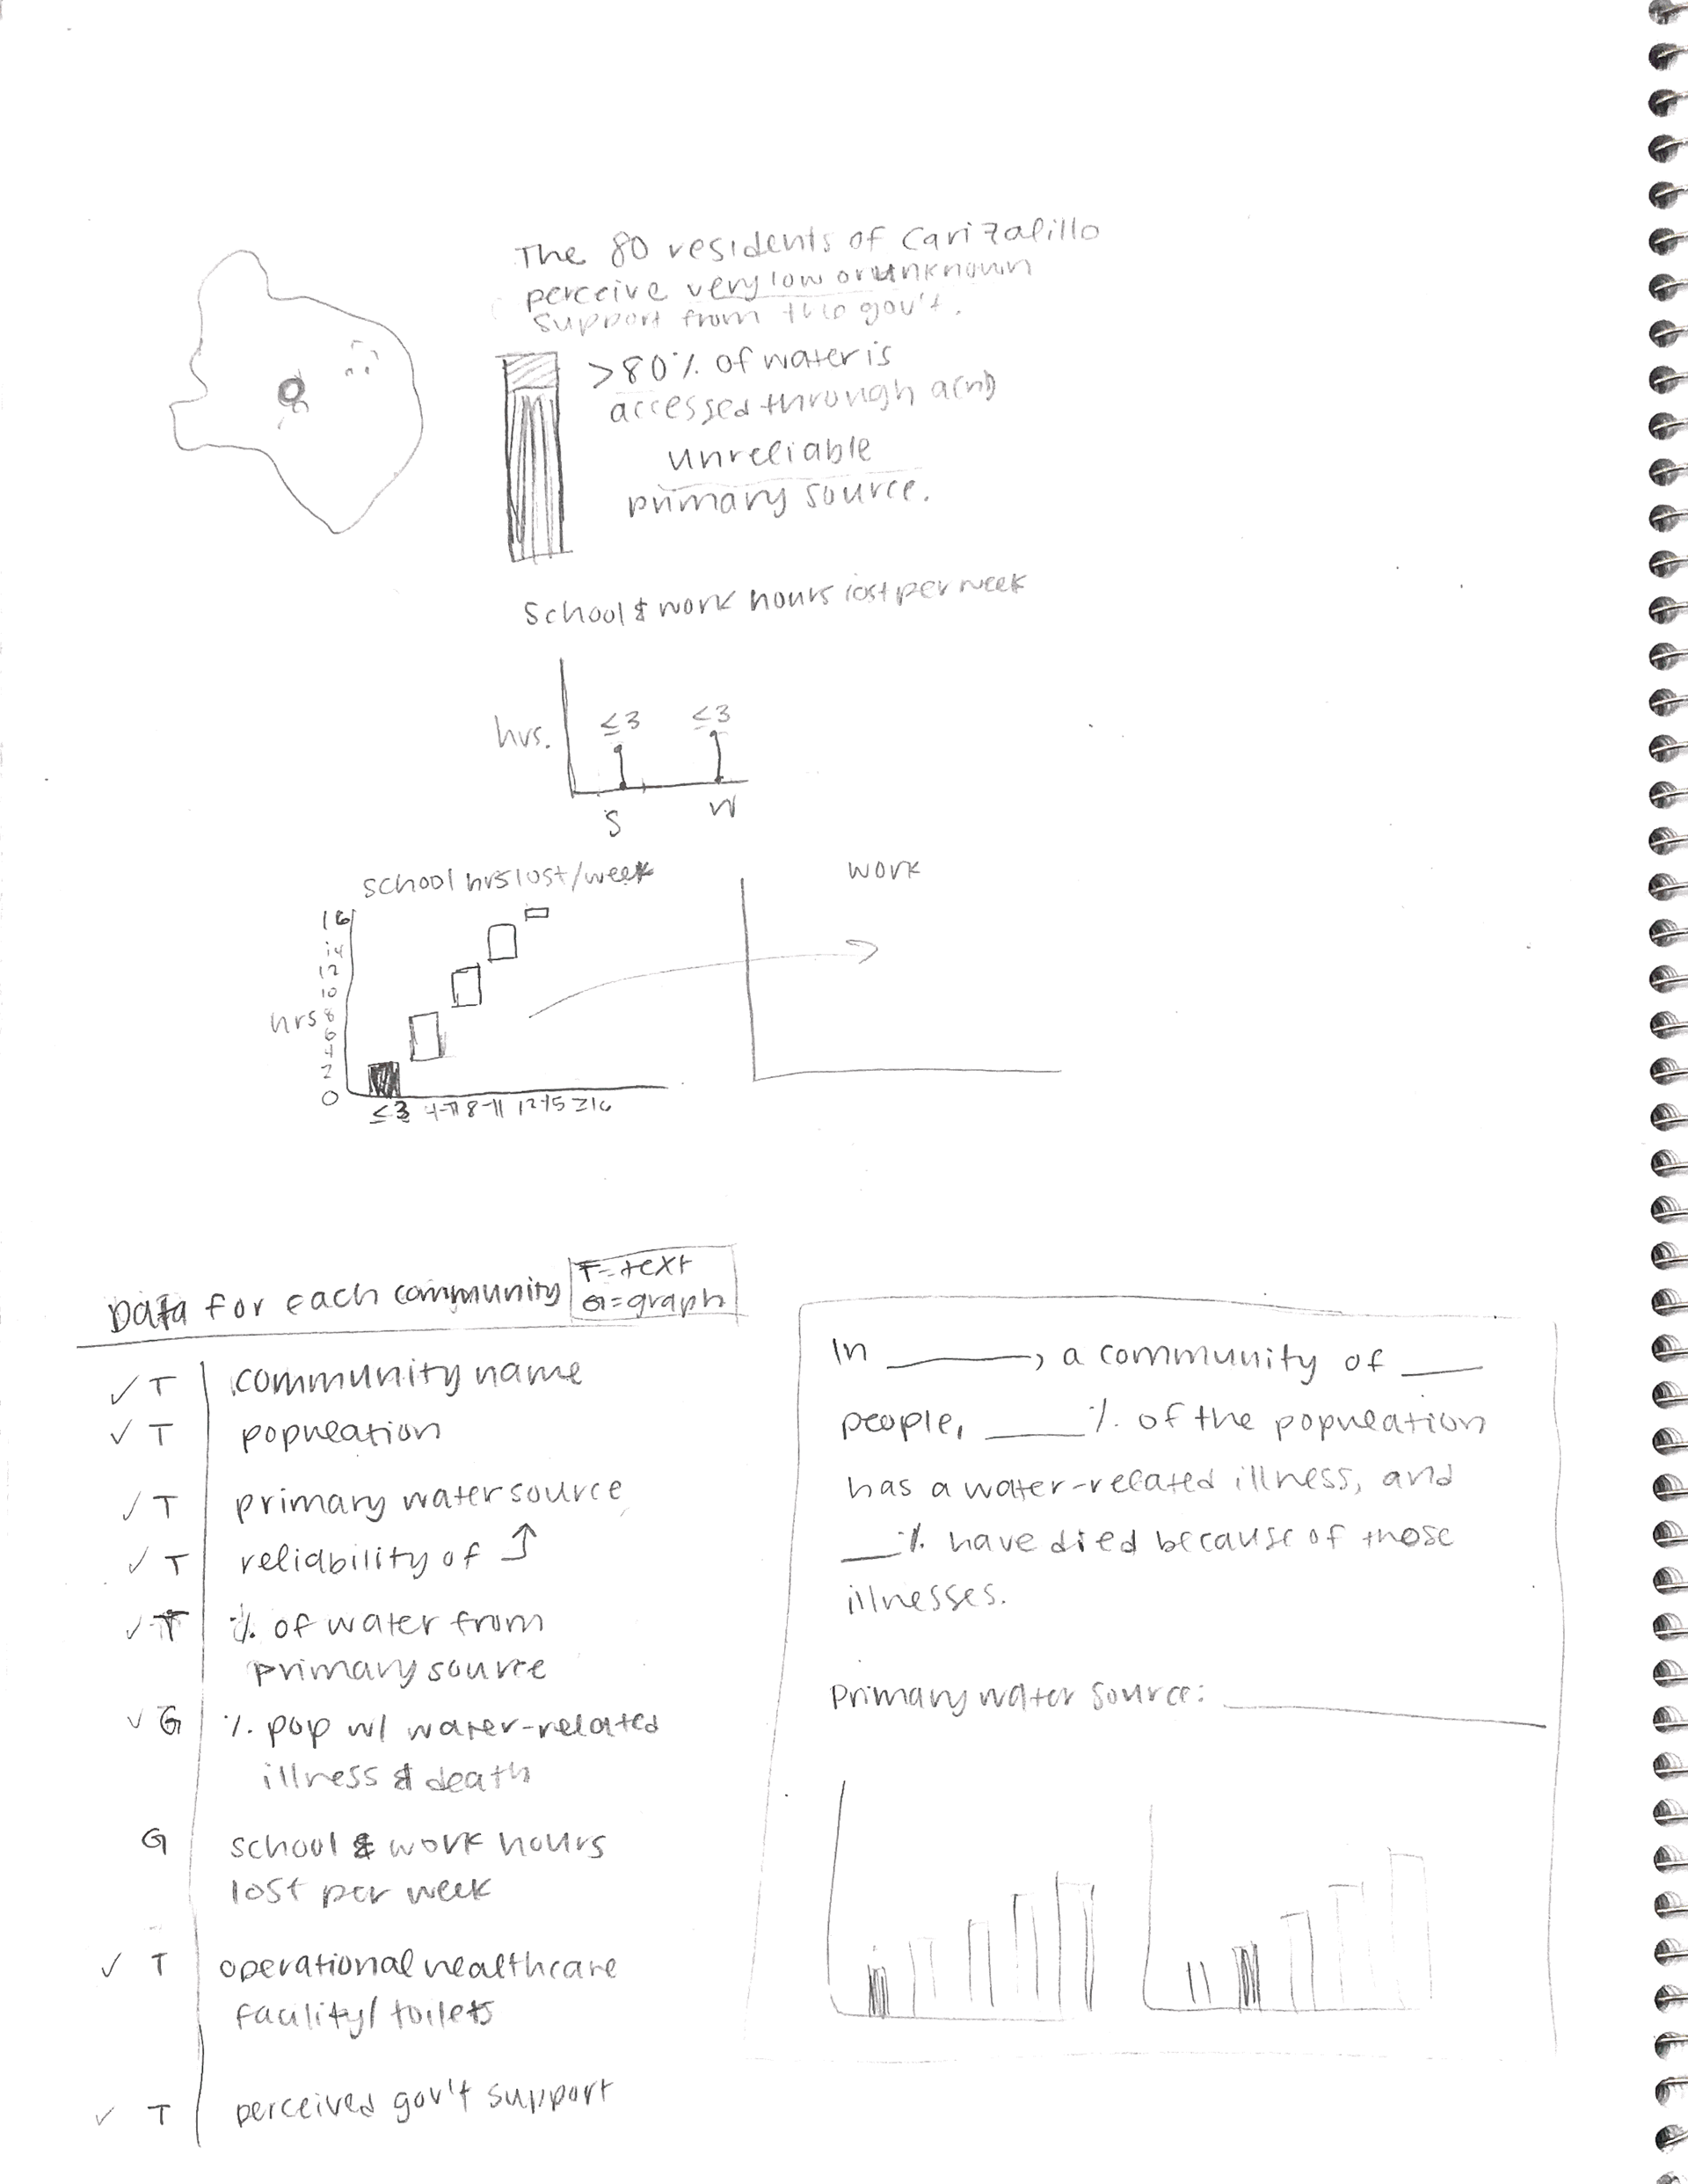
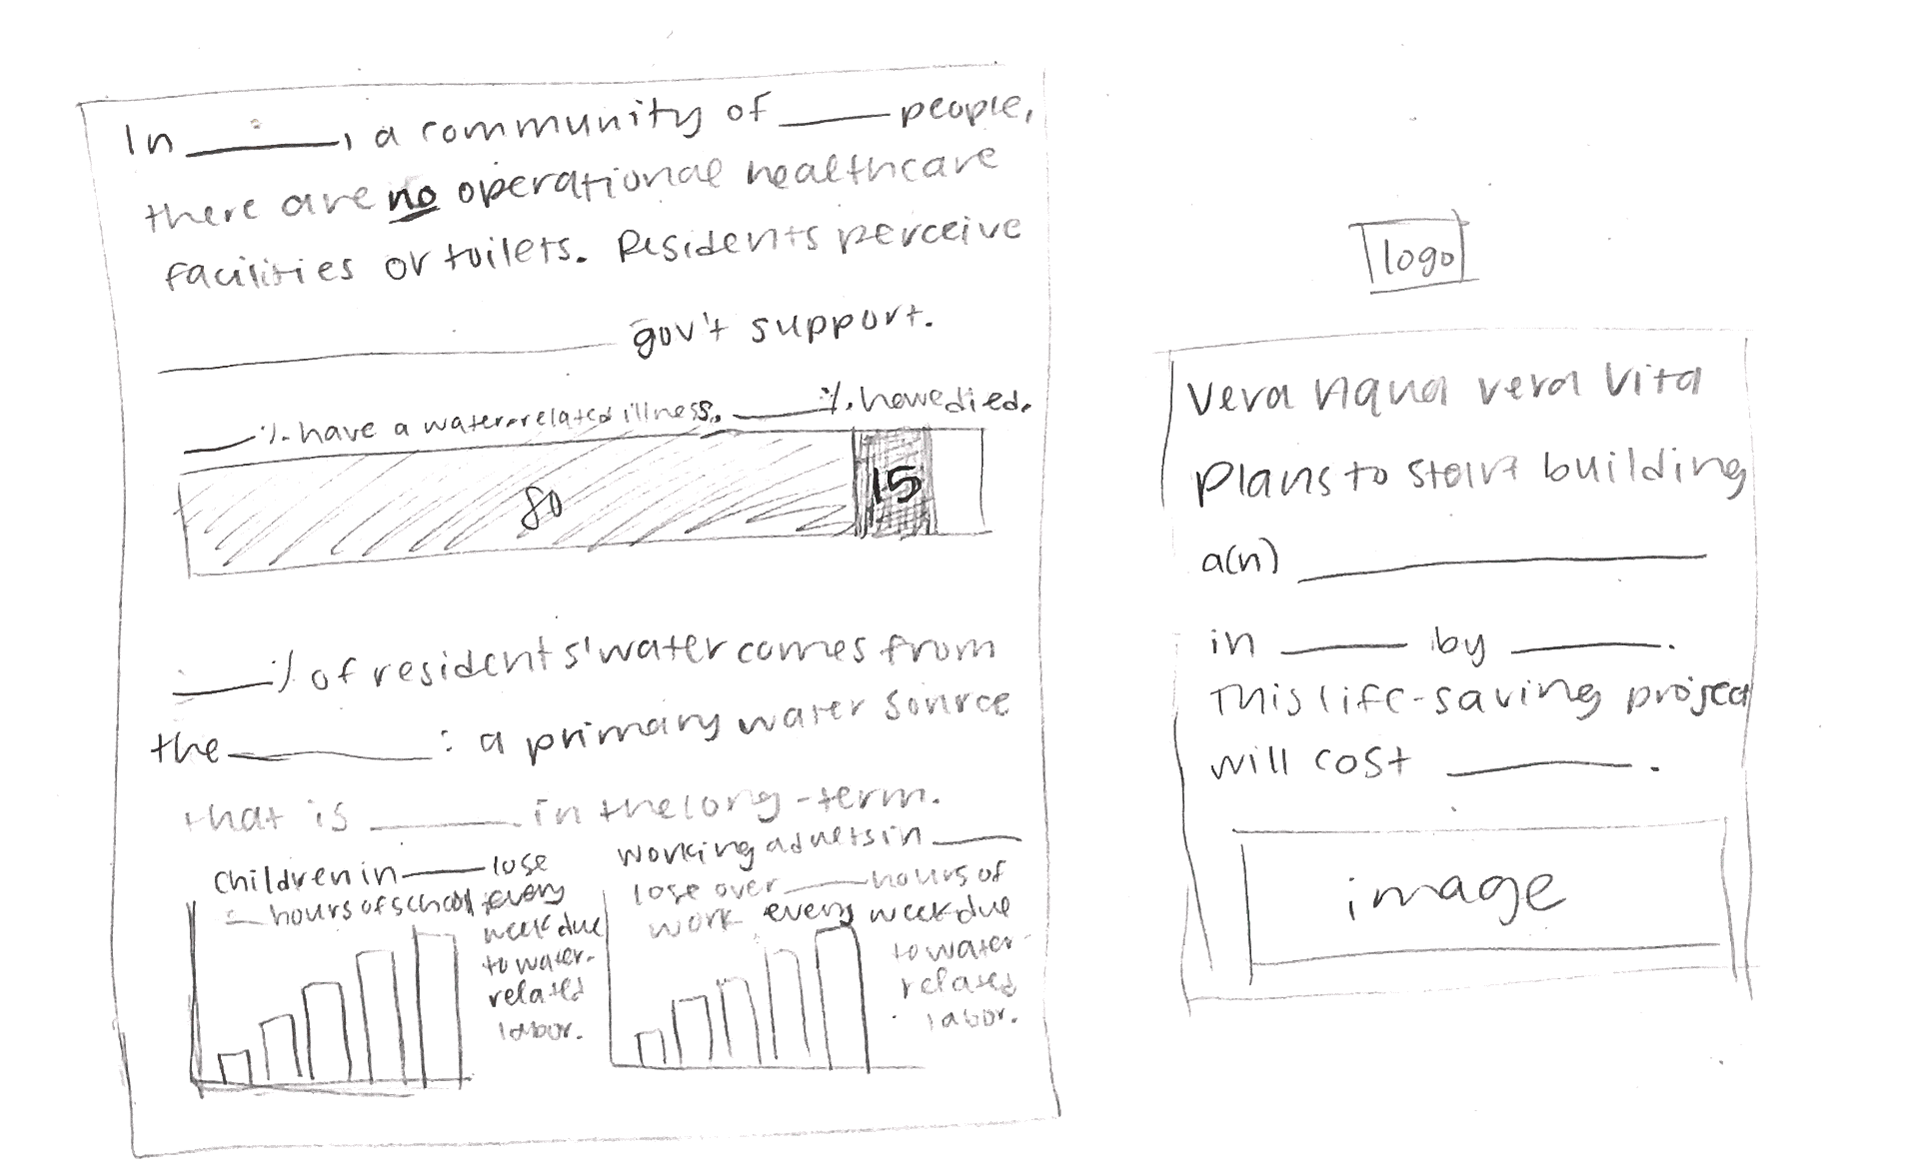
My process for this visualization was heavily focused on analog sketching as I worked through iterations of which data to use and how to best tell the stories of Piura residents.